
PROJECT MAPS & INTERPRETATIONS
Explore the project visually
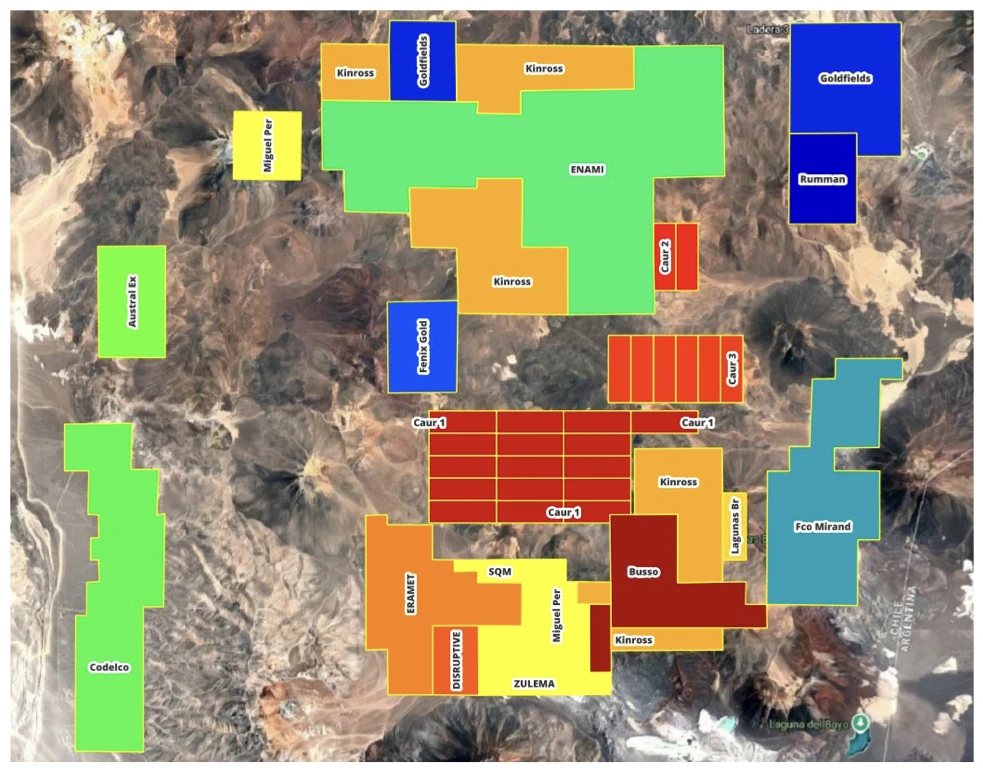
Regional context and selected CAUR alteration maps.
REGIONAL CONTEXT
CAUR in the Maricunga Gold Belt
The maps show geological context. Current titles and the relationship of historical drilling to concession boundaries require verification.
Additional regional illustration
MORE PROJECT MAPS
Maps in context
Open each map in its relevant project, geology or exploration section for the interpretation and technical context.

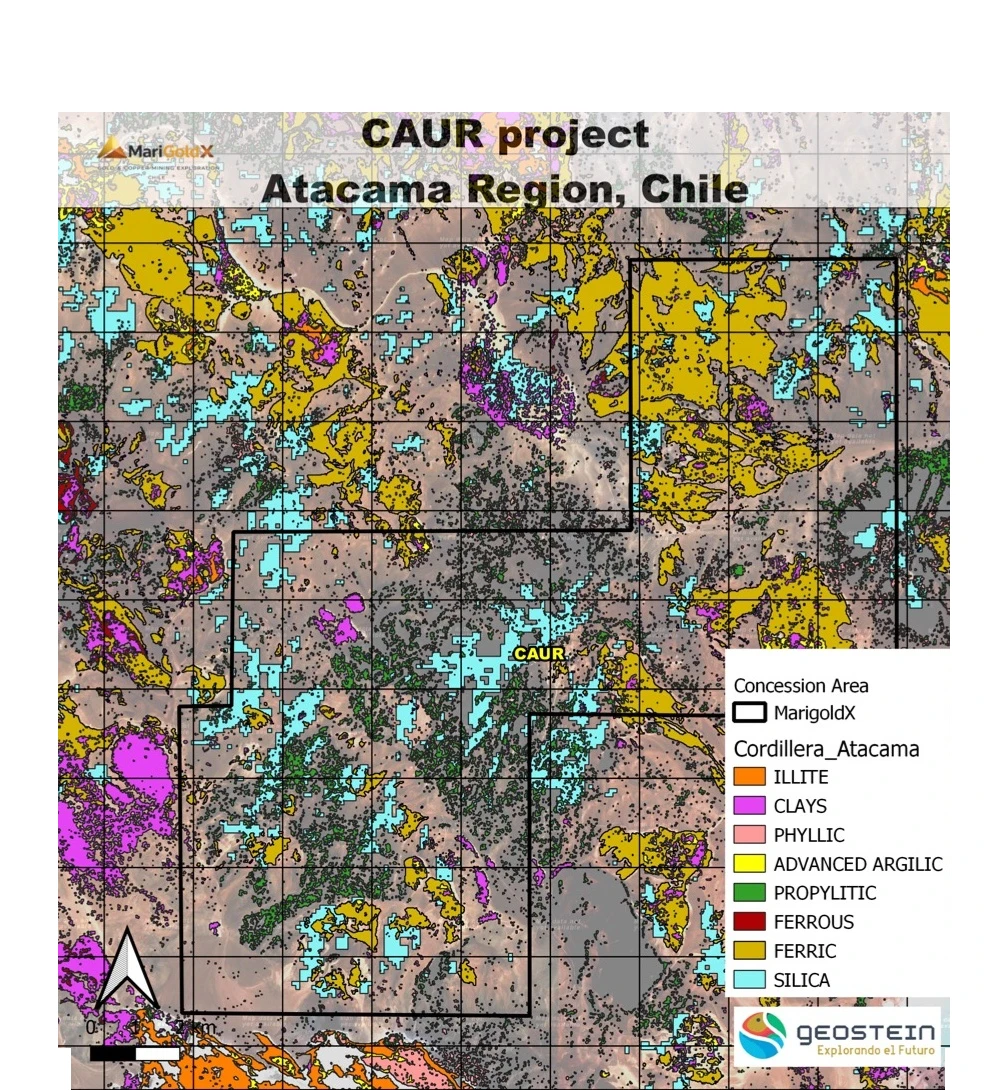
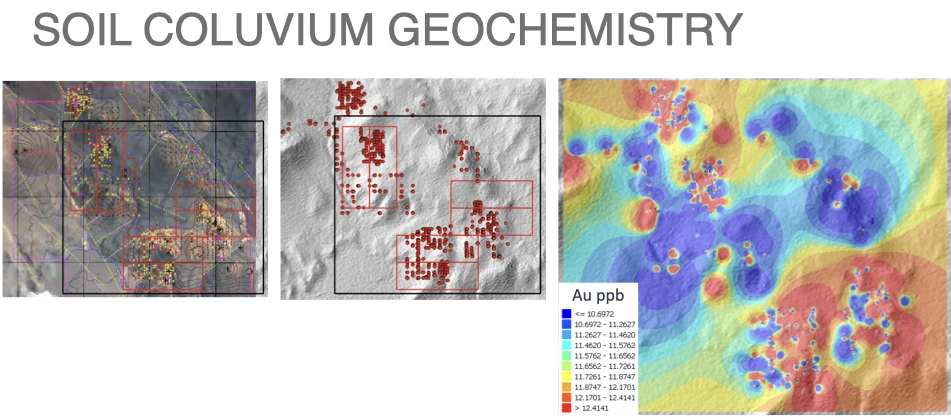
GEOSTEIN · PRISMA HYPERSPECTRAL DATA
HSI maps in context
Surface alteration layers from Geostein’s PRISMA hyperspectral interpretation. The outlined study window is not a verified concession boundary. HSI interpretations require field confirmation and do not establish gold grade, continuity or an economic deposit.
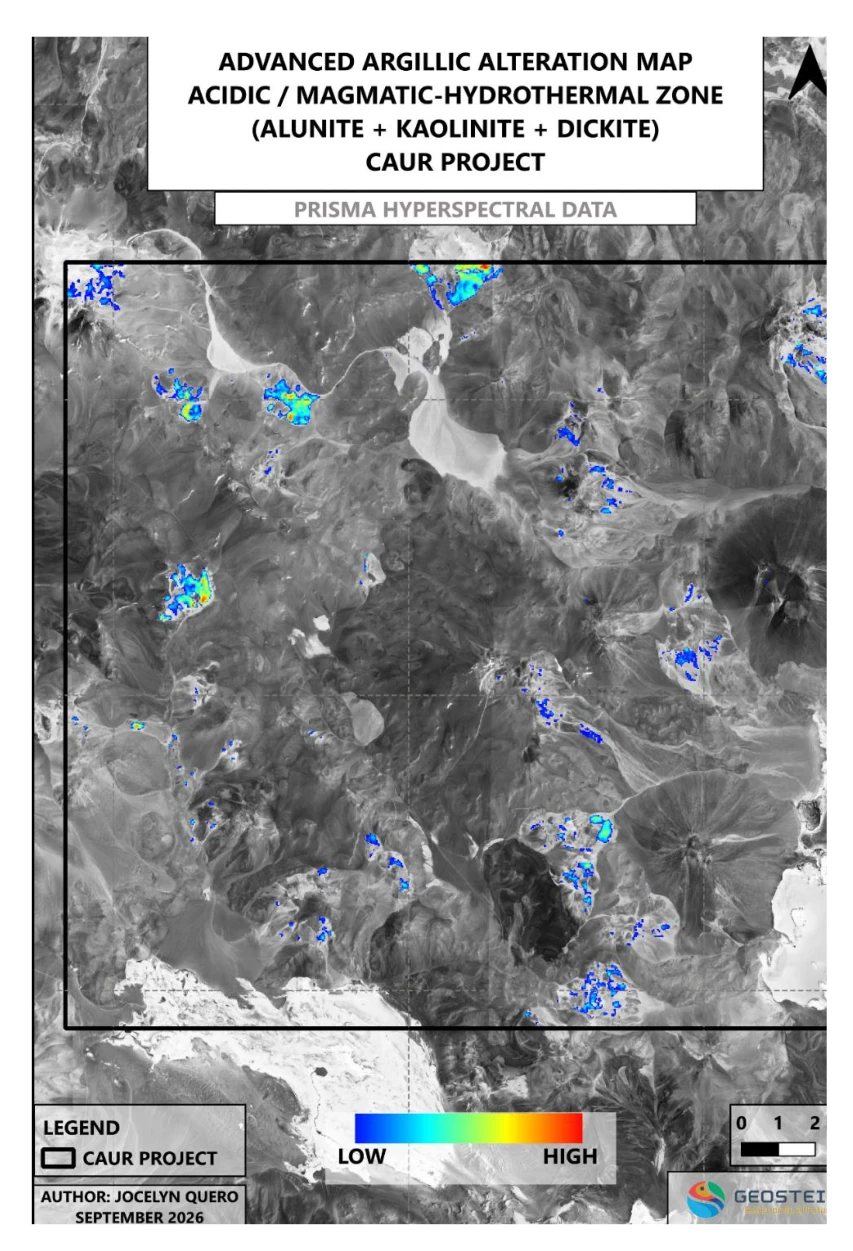
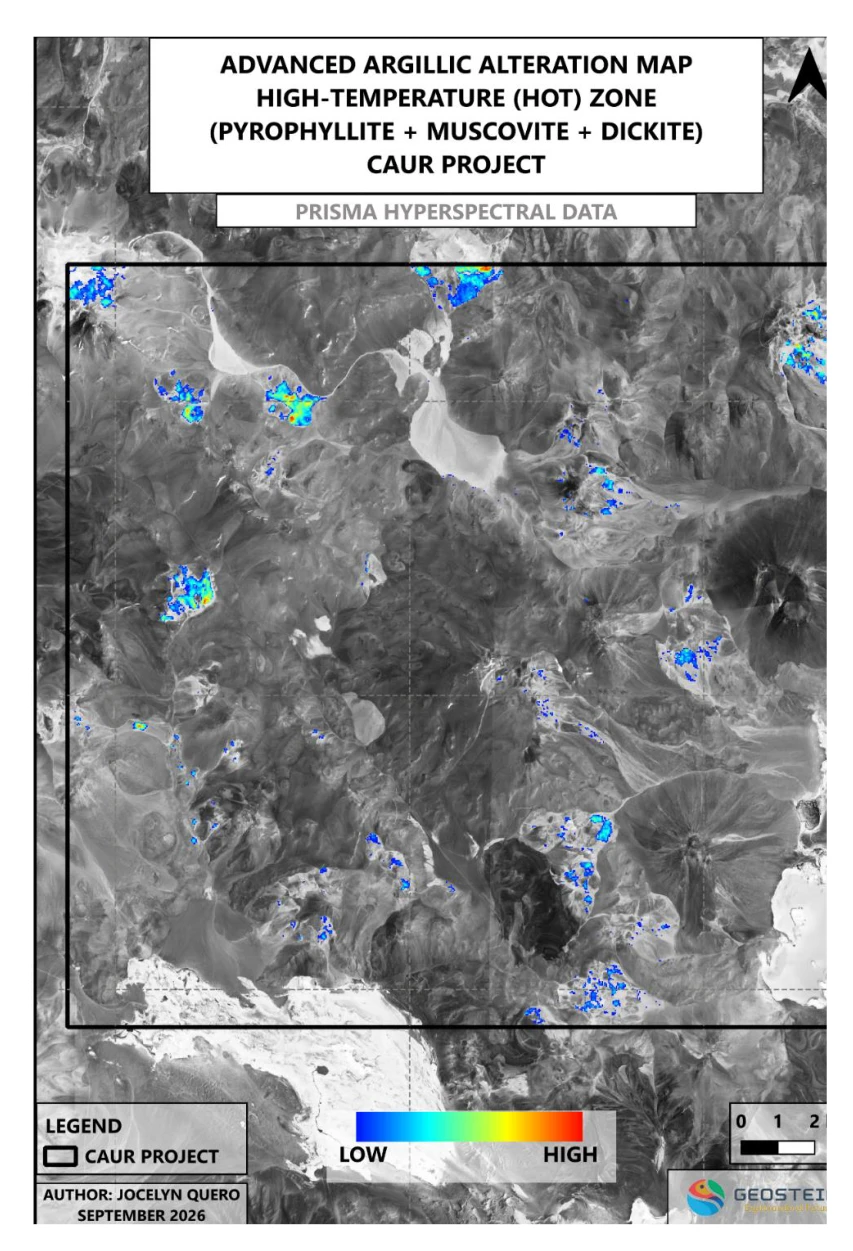
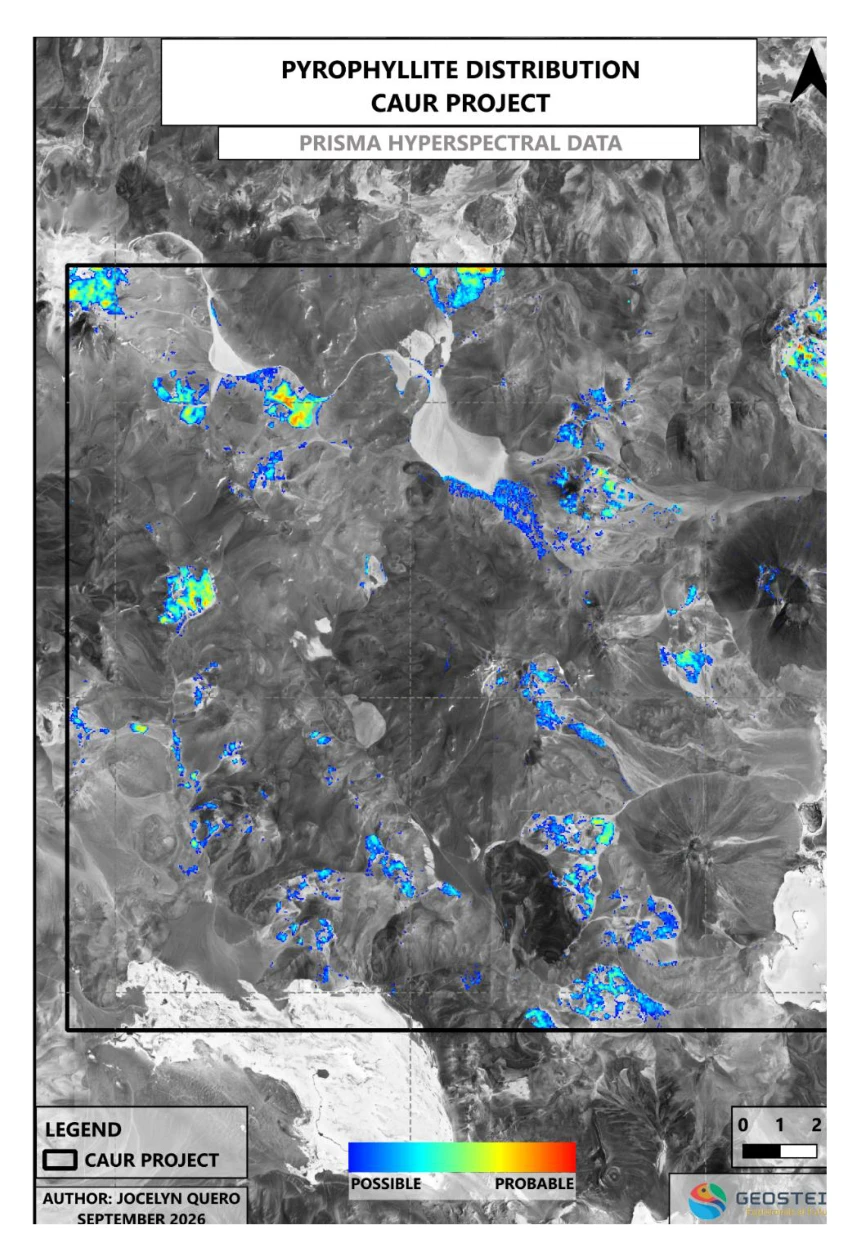
Source: Geostein CAUR HSI report, pp. 18, 34–35. Original mineral-map labels are retained.
CONCEPTUAL CROSS-SECTION
The geological model
PARTNER WITH MARIGOLDX
Review the technical opportunity
Contact the MariGoldX team to discuss the exploration model and supporting information.